Unsupervised Conformal Novelty Detection for Hierarchical Data

Electric vehicle (EV) battery packs exhibit a natural pack–module–cell hierarchy, which induces dependence among measurements within the same module. Such hierarchical dependence poses challenges for the direct application of conventional novelty detection methods. To address these challenges, we develop conformal e-value procedures for hierarchical novelty detection, with the goal of controlling the false discovery rate (FDR) at both the group and unit levels. We combine hierarchical conformal score construction with eBH and U-eBH multiple testing procedures, and consider split conformal, full conformal, and group-wise conformal regimes. The proposed methods are evaluated through simulation studies and an analysis of EV battery pack data, where they provide empirical FDR control and detect localized module- and cell-level irregularities.
Motivation
Real-world industrial data — such as EV battery manufacturing — presents three compounding challenges that standard anomaly detection cannot handle jointly:
- Hierarchical dependence: Cells within the same module share a common group effect, violating the IID assumption of most methods.
- No anomaly labels: Ground-truth defect labels are expensive or infeasible to obtain in manufacturing, ruling out supervised approaches.
- Multiple comparisons: Simultaneously testing hundreds of units inflates false discoveries without a principled error-control mechanism.
Method Overview
We frame hierarchical novelty detection as a multiple hypothesis testing problem at two levels simultaneously:
- Group-level (HC-GND) — Does a test module contain any anomalous cells?
- Unit-level (HC-UND) — Which specific cells within each module are anomalous?
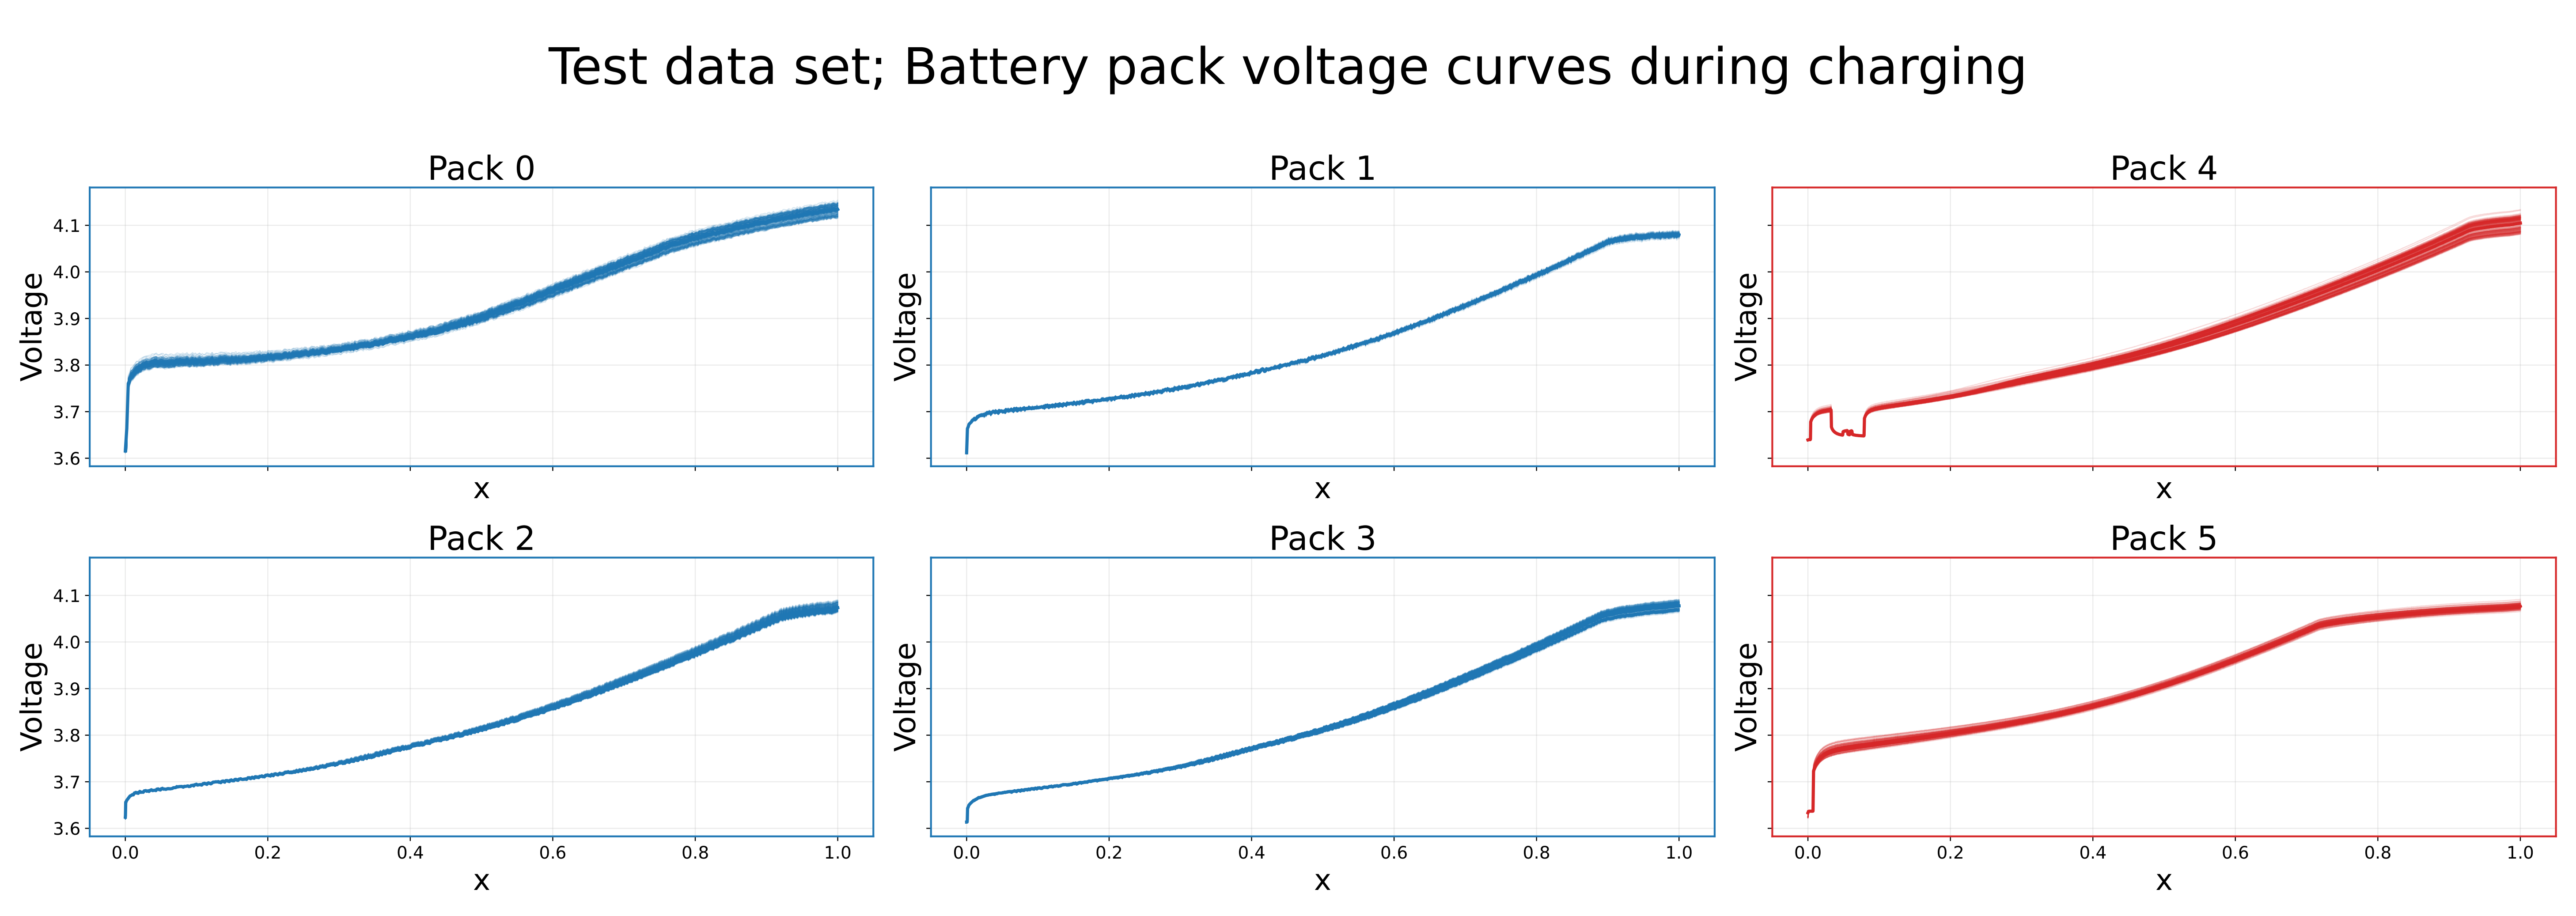
Feature extraction: Charging voltage time series are treated as functional observations. Functional PCA (FPCA) projects each cell’s charging curve onto a low-dimensional score vector, placing cells from all packs on a common feature space.
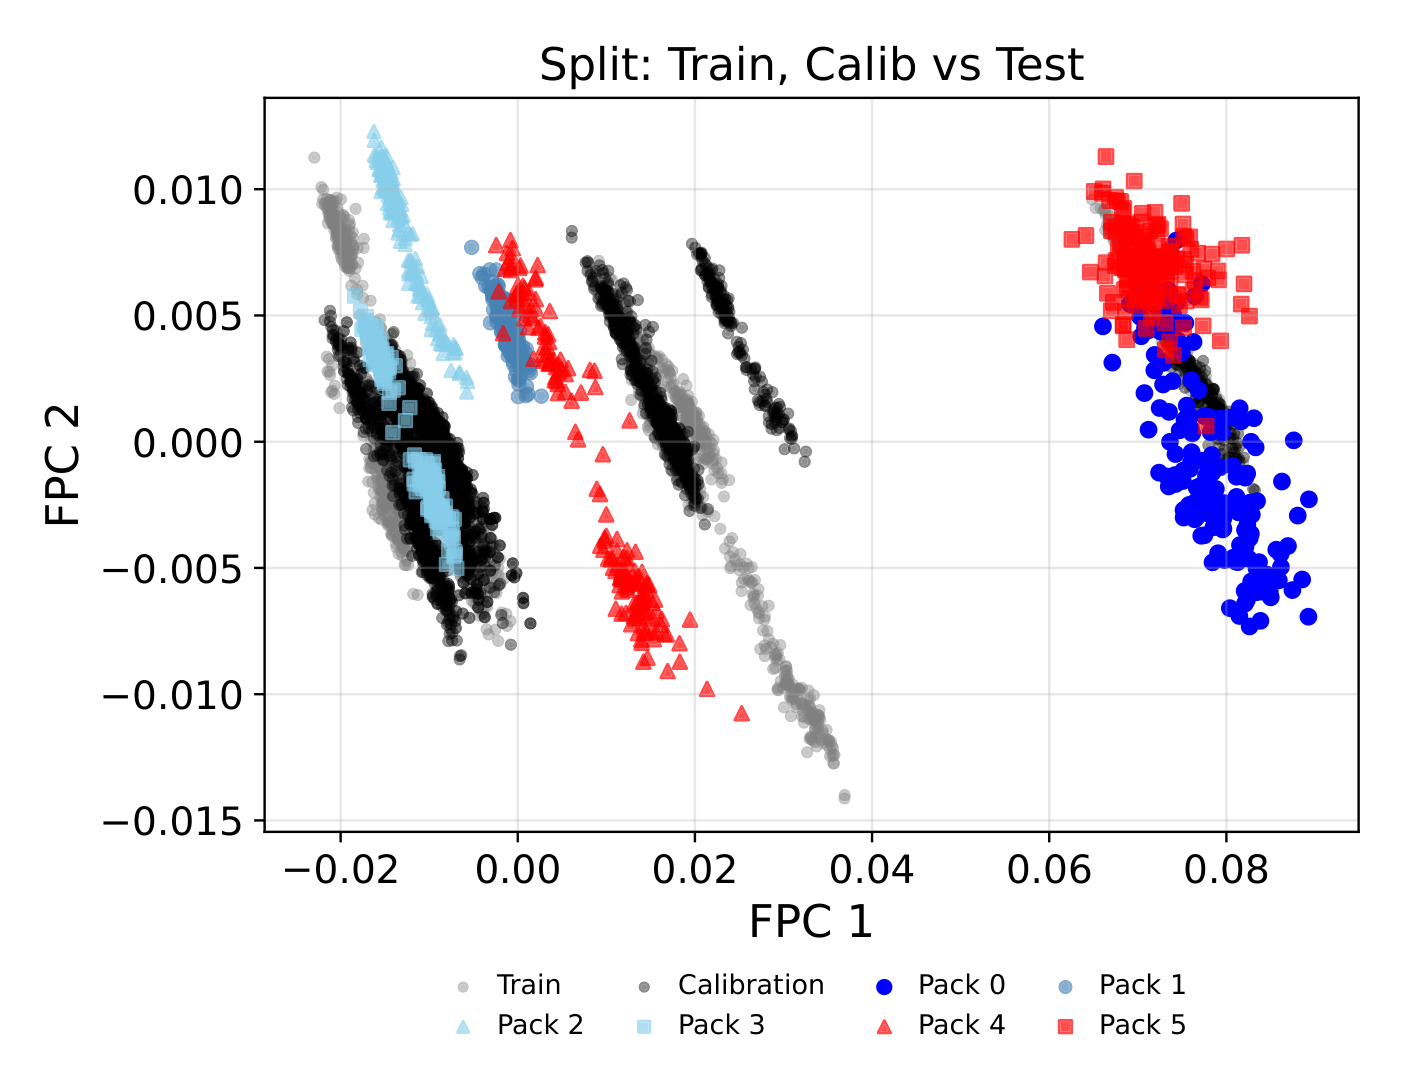
Nonconformity score: For each cell, we compute a Mahalanobis-distance-based nonconformity score relative to a robust trimmed-mean group center. This naturally respects within-group dependence.
Multiple testing: Scores are converted to conformal e-values — non-negative statistics satisfying E[e] ≤ 1 under the null — and tested jointly via the eBH / U-eBH procedure, guaranteeing FDR control under minimal distributional assumptions.
We implement three conformal regimes with different data-efficiency / robustness trade-offs:
| Regime | Training data | Contamination risk | Theoretical FDR guarantee |
|---|---|---|---|
| HSC (Split) | Reference only | None | ✓ Both levels |
| HFC (Full) | Reference + all test | Higher | ✓ Group level |
| HGC (Group-wise) | Reference + one test group | Moderate | ✓ Group level |
Results
Simulation Study
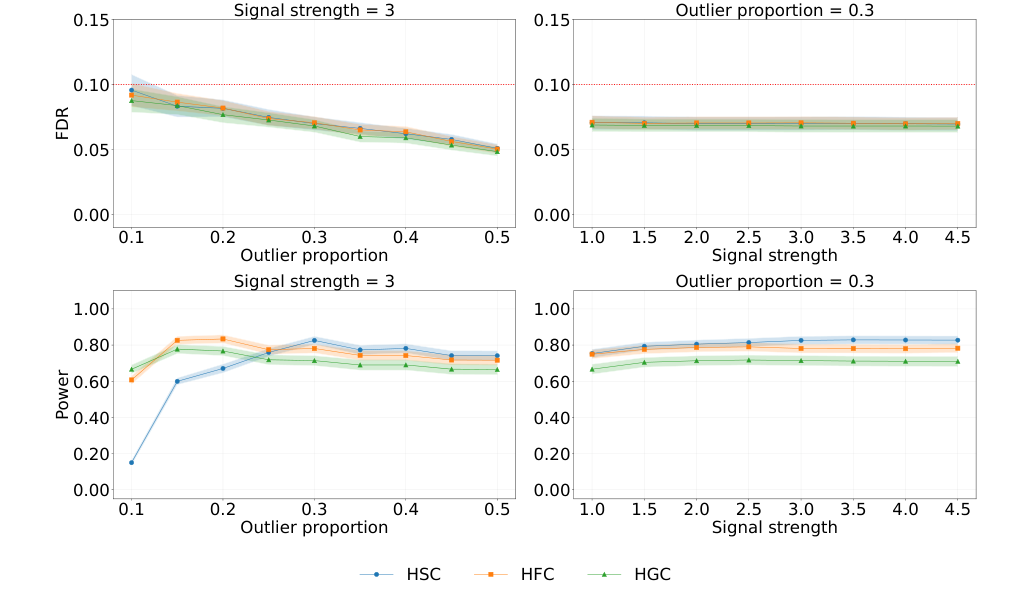
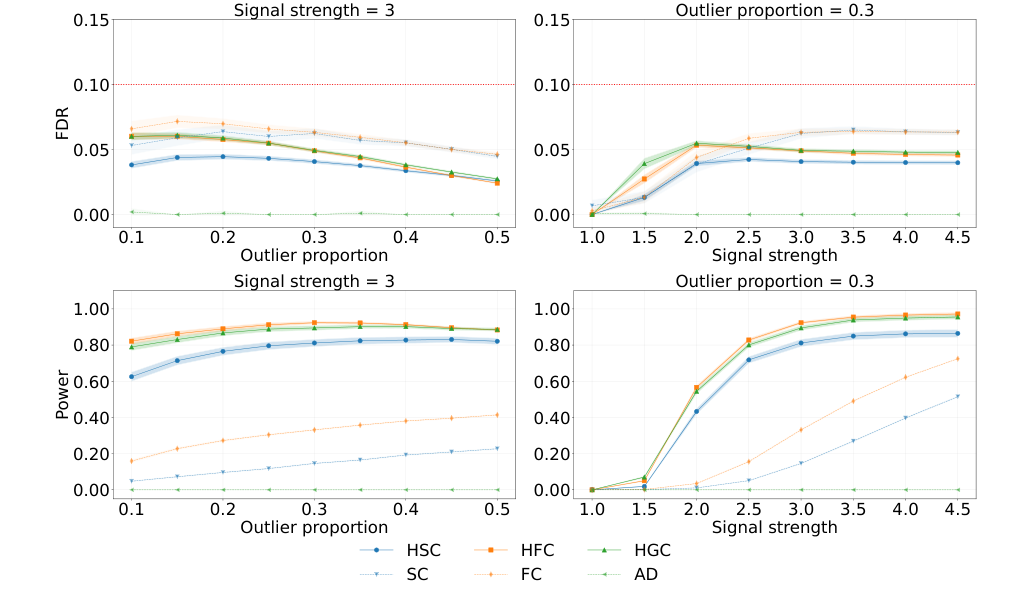
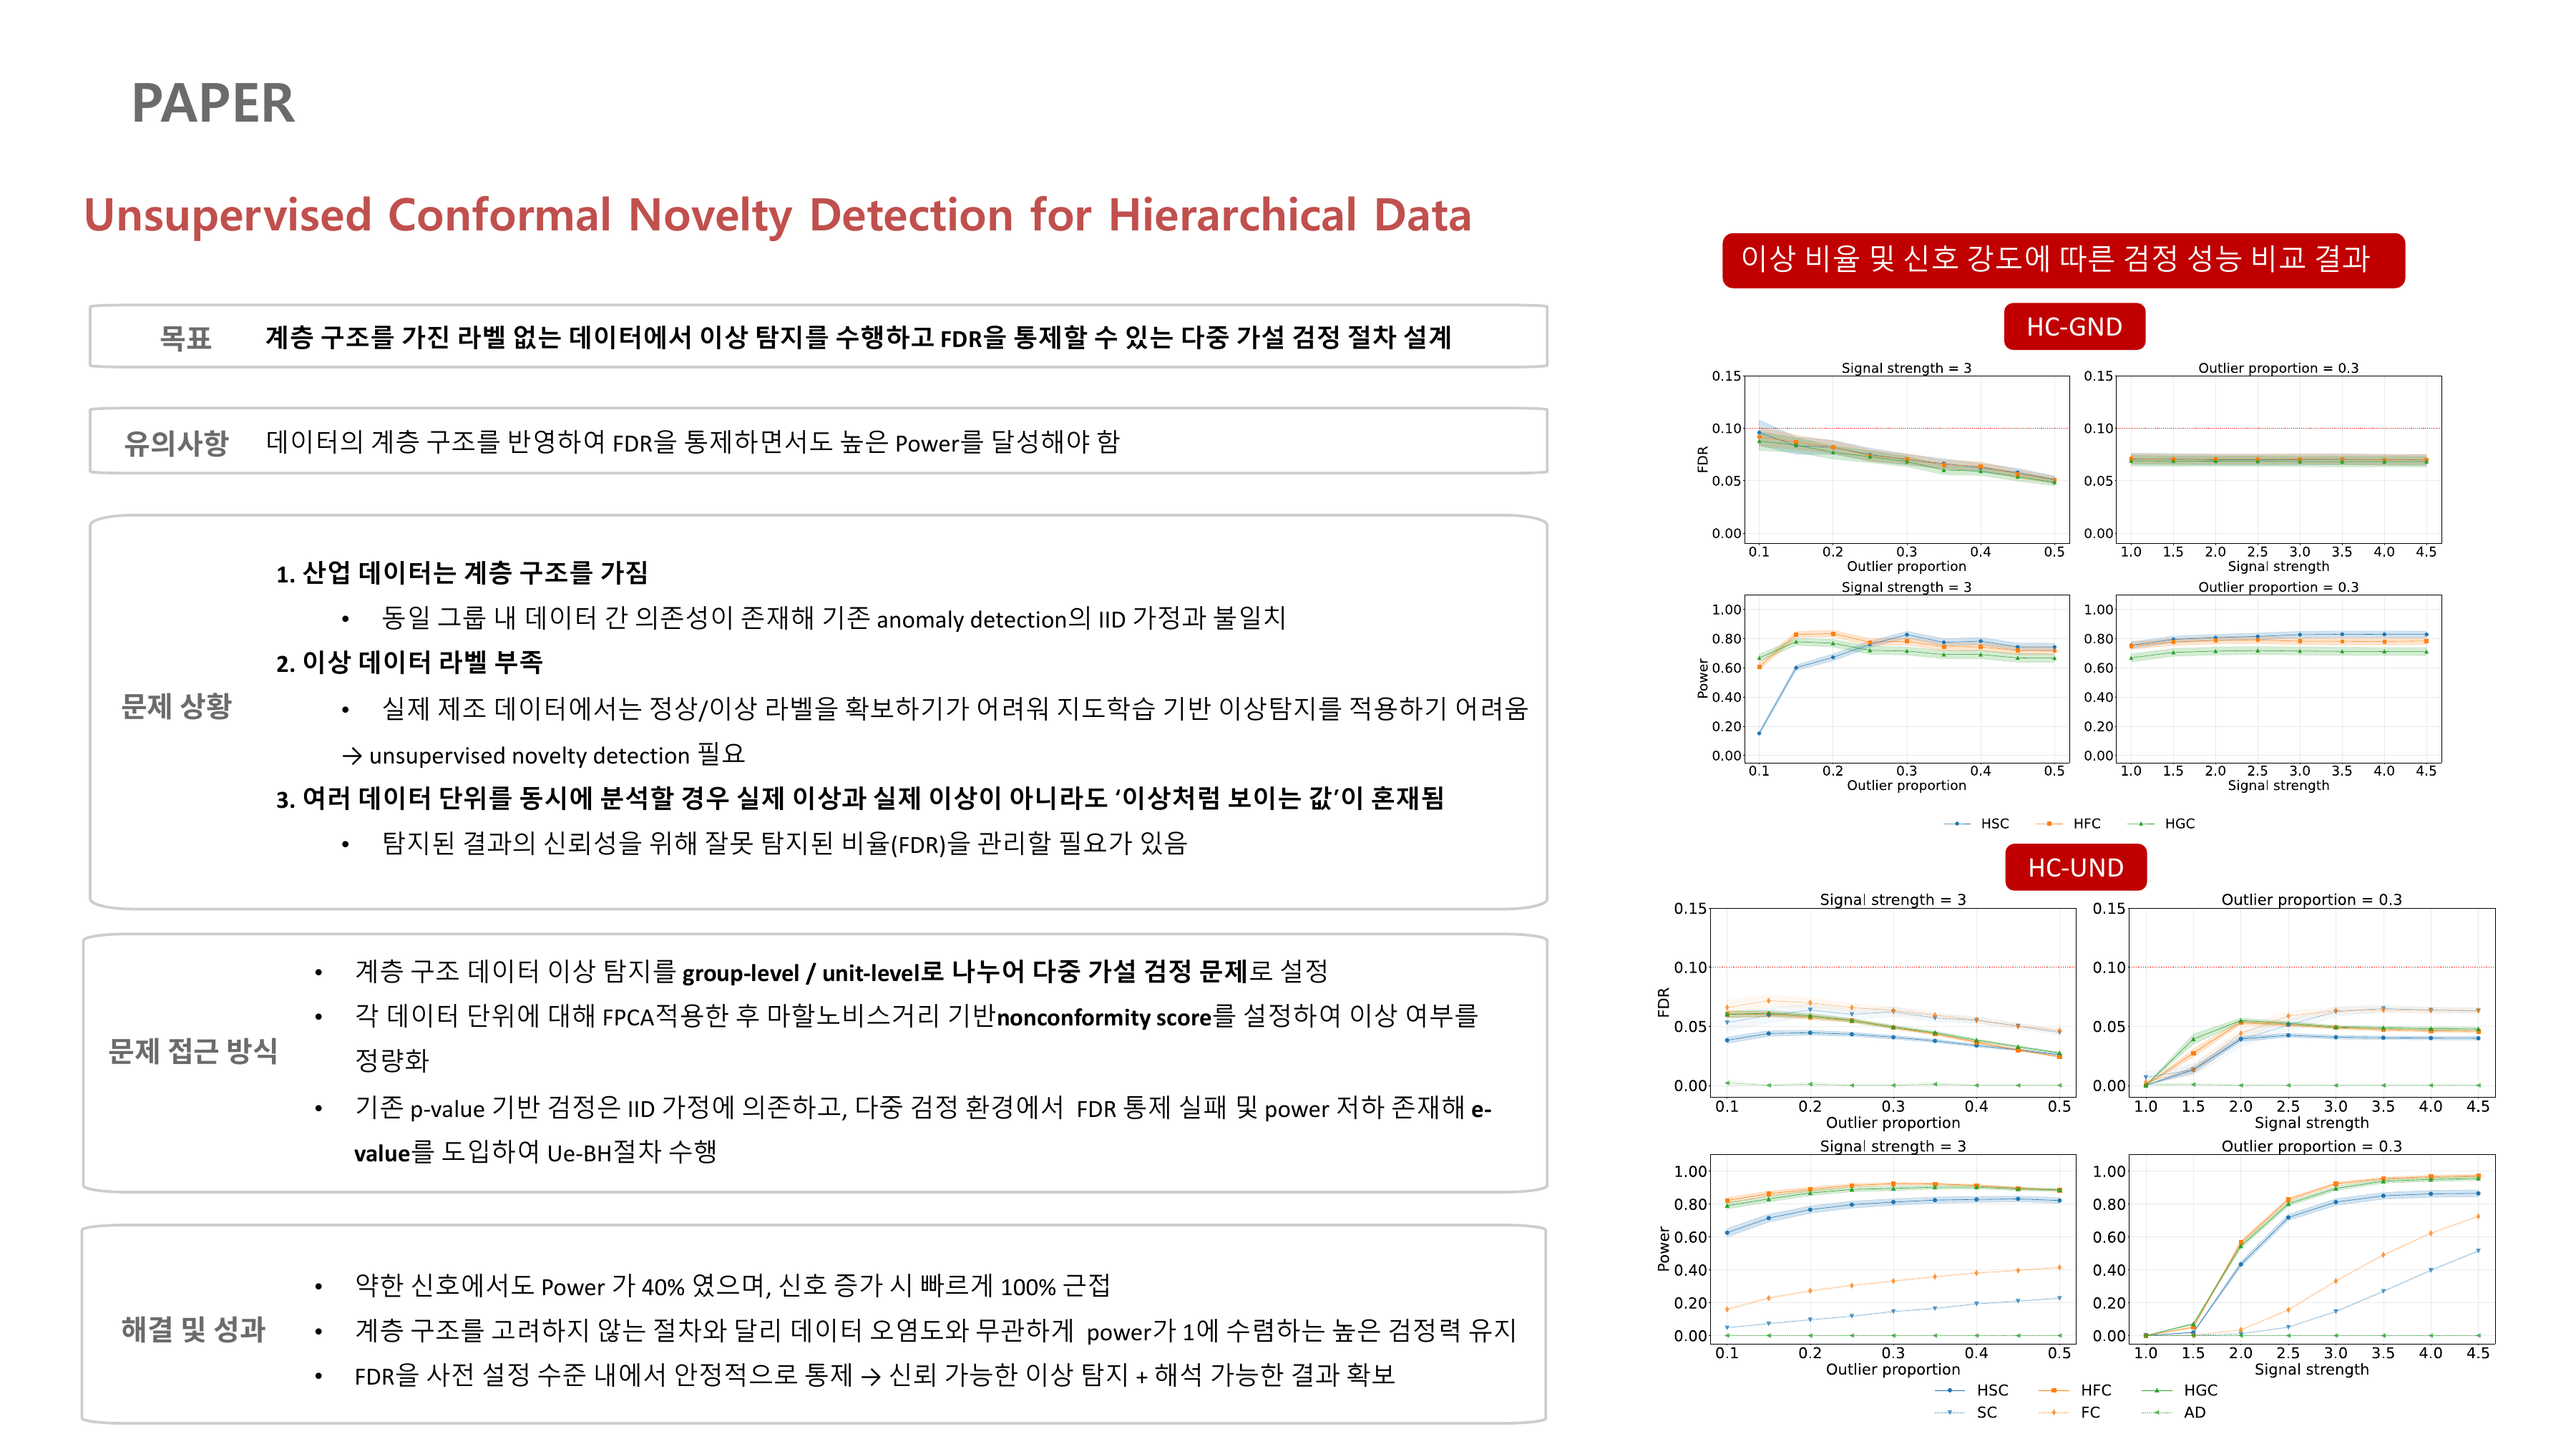
Key findings across 1,000 simulation replicates (α = 0.1):
- Empirical FDR remains at or below the target level across all outlier proportions and signal strengths.
- At weak signal, power reaches ~40%; as signal increases, power approaches 100%.
- Hierarchical methods outperform non-hierarchical baselines by leveraging within-group structure.
EV Battery Pack Application
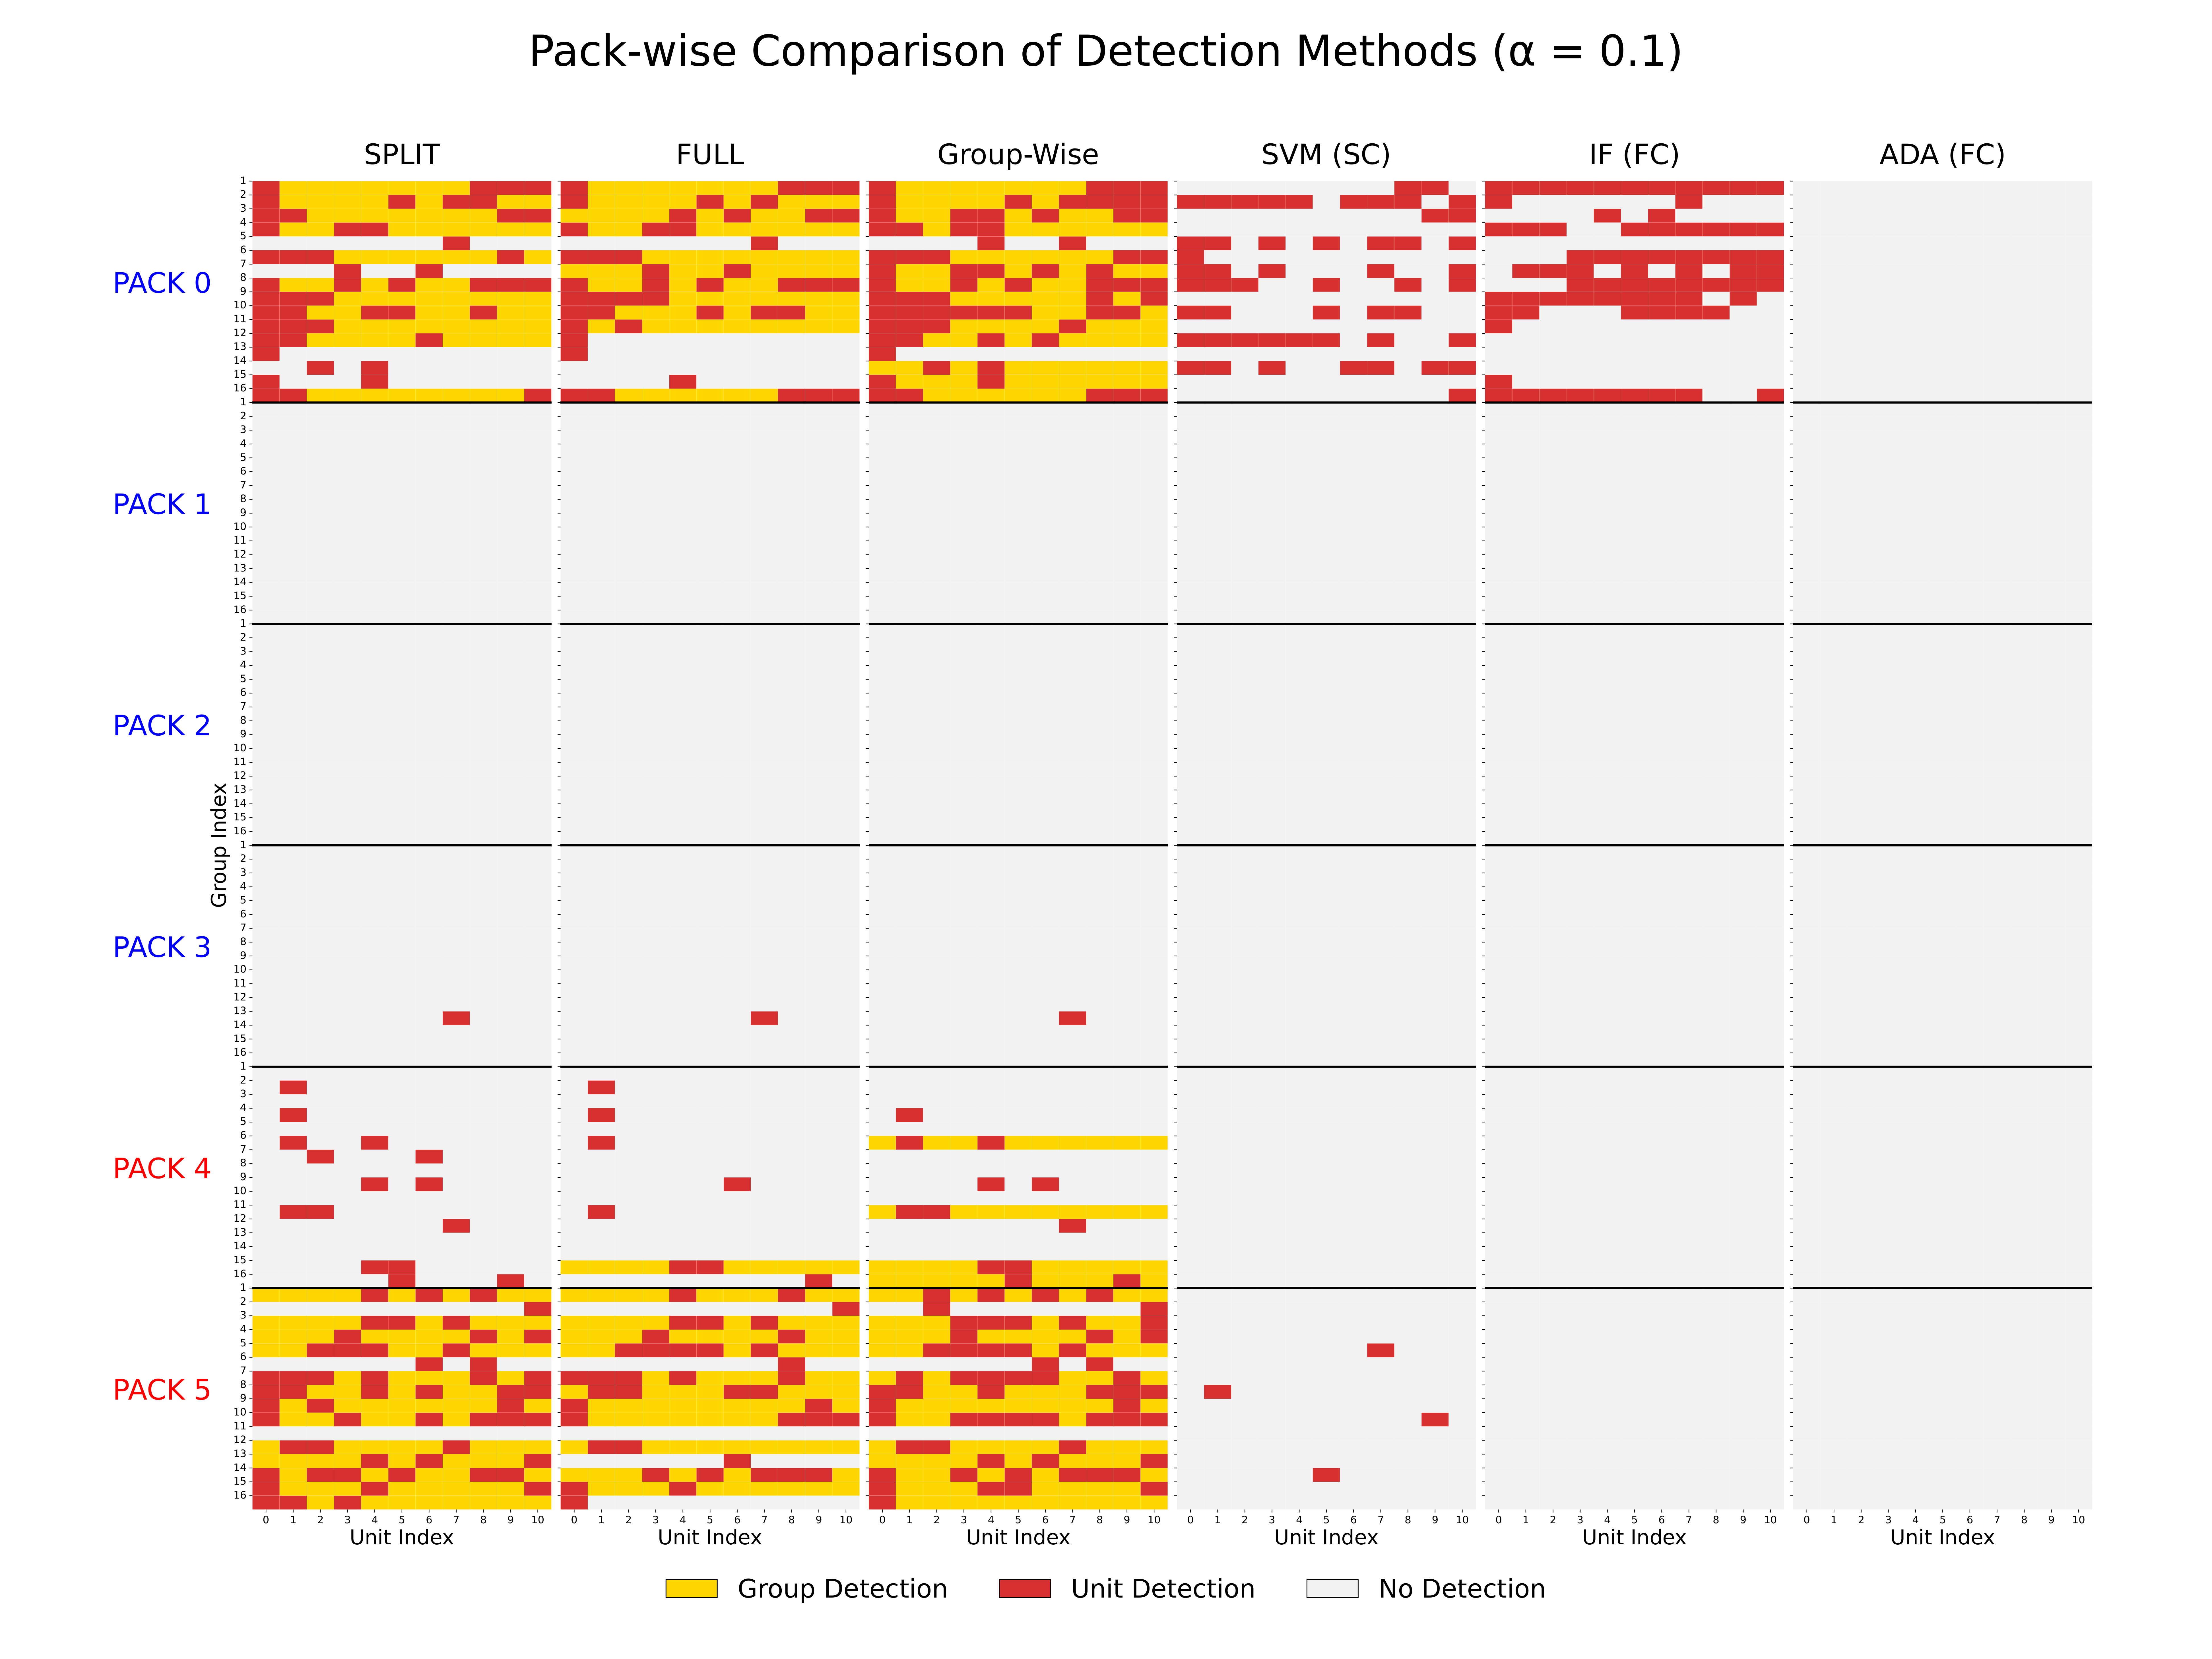
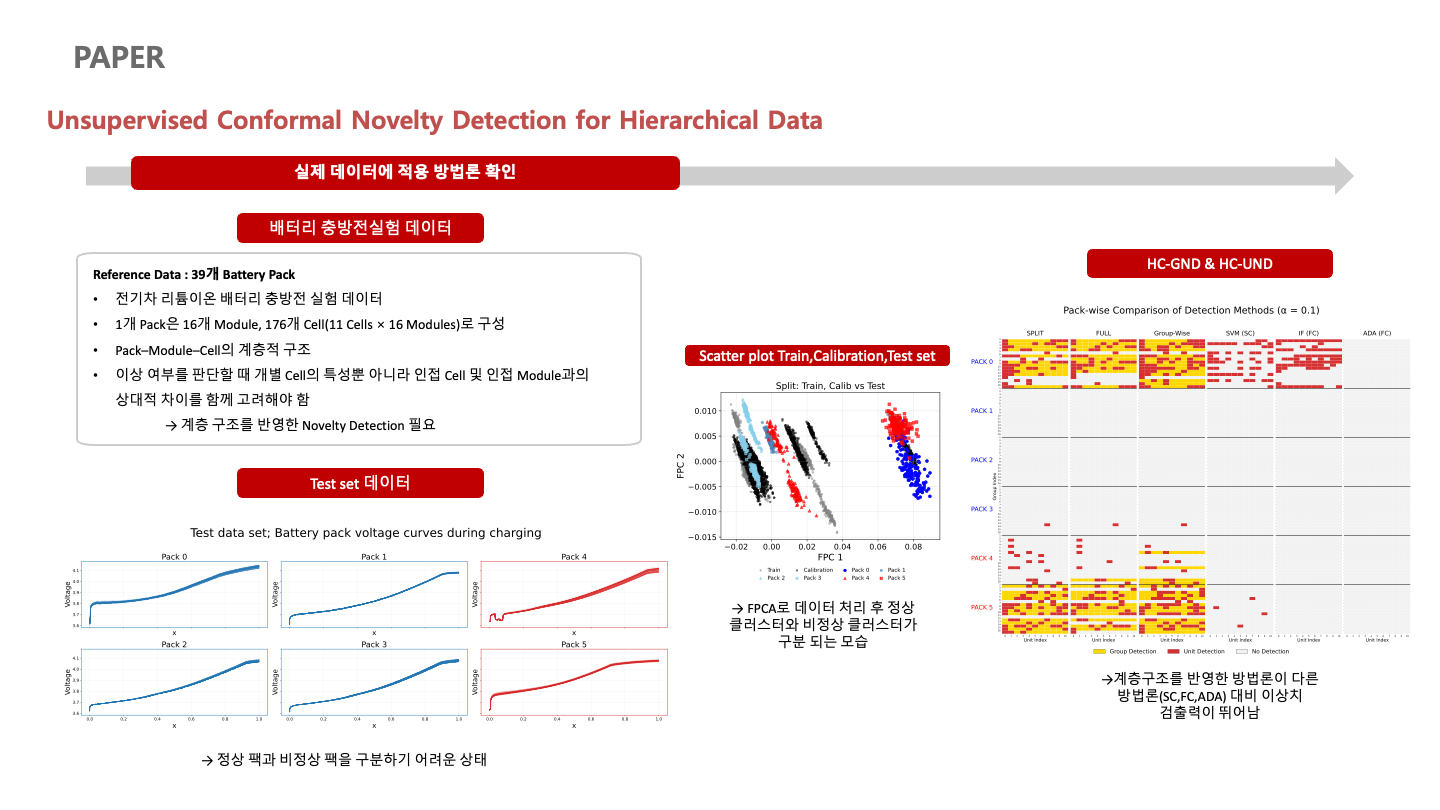
- The proposed procedures detect localized module- and cell-level irregularities not captured by pack-level labels.
- Non-hierarchical baselines concentrate false detections on Normal Pack 0 and miss structured signals in Abnormal Pack 5.
- Results provide an additional diagnostic layer when only coarse pack-level labels are available.
Presentation Slides